4 September 2020

Latest telecoms and pay-TV complaints revealed

Ofcom has today published the latest league tables on the complaints we’ve received about the UK’s major home phone, broadband, mobile and pay-TV firms.

The quarterly report reveals the number of complaints made to us between January and March this year -capturing data from the first two weeks of the Covid-19 lockdown. All providers with a stable market share over 1.5% are included.
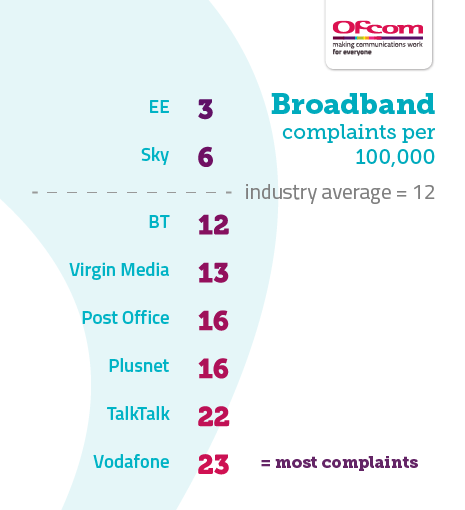
Broadband

Vodafone was the broadband provider that attracted the most complaints, with 23 complaints per 100,000 customers, while EE attracted the fewest.
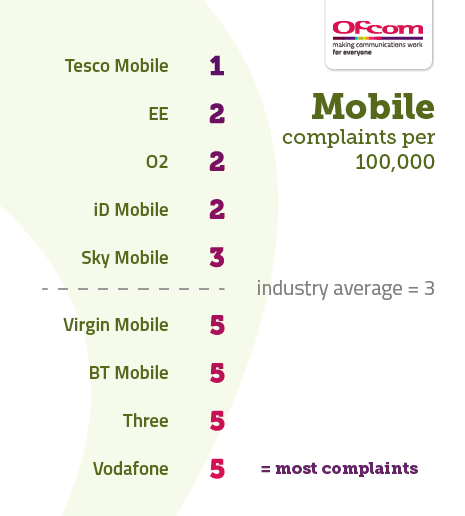
Table showing broadband complaints per 100,000 subscribers. It illustrates the providers receiving the fewest complaints at the top of the table and those receiving the most complaints are placed at the bottom of the table. The results are as follows: EE 3, Sky 6, Industry average 12, BT 12, Virgin Media 13, Post Office 16, Plusnet 16, TalkTalk 22, Vodafone 23.

Mobile

Vodafone, Three, BT Mobile and Virgin Mobile attracted the most complaints, each with five complaints per 100,000 customers. Causes ranged from issues with changing providers to how complaints were handled. Tesco Mobile attracted the fewest complaints for mobile.
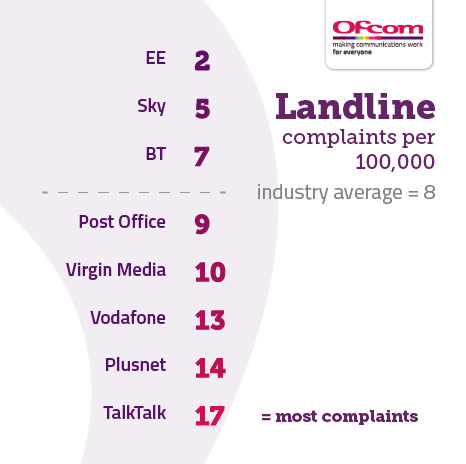
Table showing mobile complaints per 100,000 subscribers. It illustrates the providers receiving the fewest complaints at the top of the table and those receiving the most complaints are placed at the bottom of the table. The results are as follows: Tesco Mobile 1, EE 2, O2 2, id Mobile 2, Sky Mobile 3, Industry average 3, Virgin Mobile 5, BT Mobile 5, Three 5, Vodafone 5.

Home phone

TalkTalk attracted the most complaints, with 17 complaints per 100,000 customers. The most common  causes  were problems with connecting services, how complaints were handled, and billing, pricing and charges. As with broadband, EE attracted the fewest complaints.
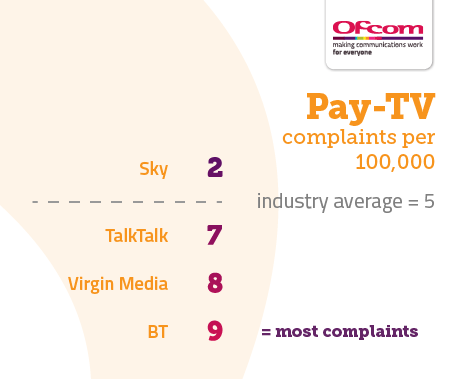
Table showing landline complaints per 100,000 subscribers. It illustrates the providers receiving the fewest complaints at the top of the table and those receiving the most complaints are placed at the bottom of the table. The results are as follows: EE 2, Sky 5, BT 7, Industry average 8, Post Office 9, Virgin Media 10, Vodafone 13, Plusnet 14, TalkTalk 17.

Pay-TV

BT attracted the most complaints, with nine complaints per 100,000 customers, while Sky attracted the fewest complaints.

Table showing Pay-tv complaints per 100,000 subscribers. It illustrates the providers receiving the fewest complaints at the top of the table and those receiving the most complaints are placed at the bottom of the table. The results are as follows: Sky 2, Industry average 5, TalkTalk 7, Virgin Media 8, BT 9.

Complaints information helps people to think about quality of service when they are shopping around for a new provider and encourages firms to improve their performance.

See also...