
Today we’ve published the latest league tables of complaints we’ve received about the UK’s major home phone, broadband, mobile and pay-TV firms.
The report reveals the number of complaints made to Ofcom in the first quarter of this year, from January to March.
We gather this data to improve our understanding of the causes of customer dissatisfaction. It allows us to identify the reasons people complain, and which services and providers they complain about.
We do this every quarter, comparing providers’ performance by publishing the number of complaints that we received about them relative to the size of their customer bases (per 100,000 customers).
Fixed broadband
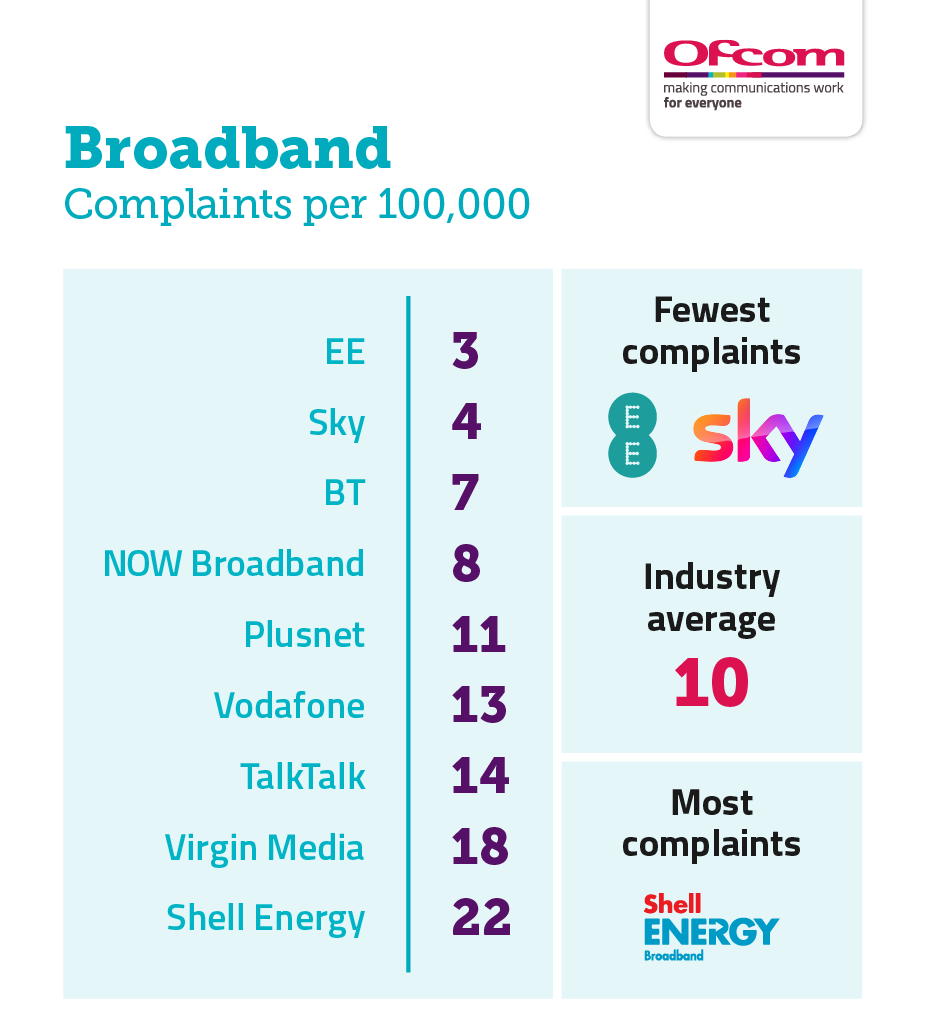
How the providers ranked
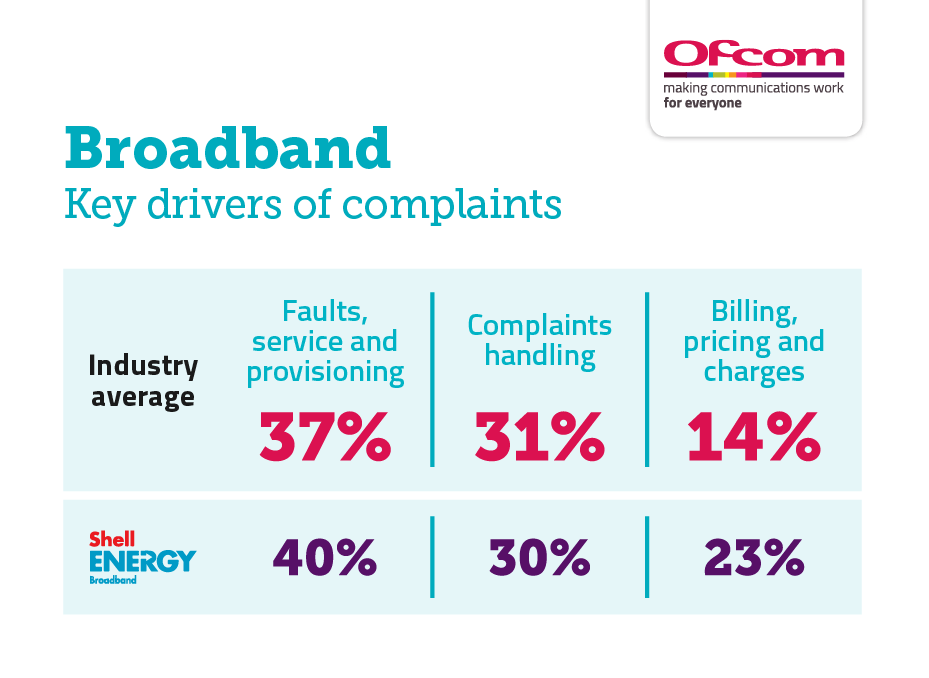
Reasons for complaining
Landline
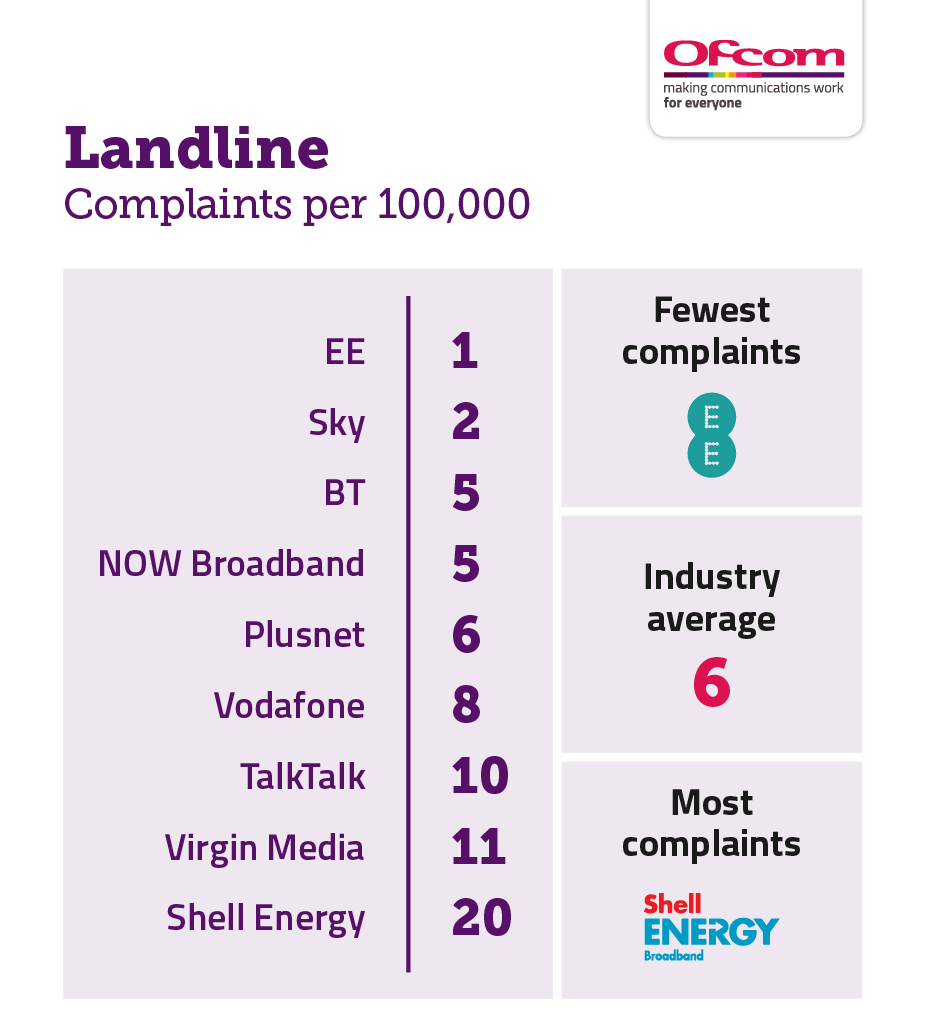
How the providers ranked
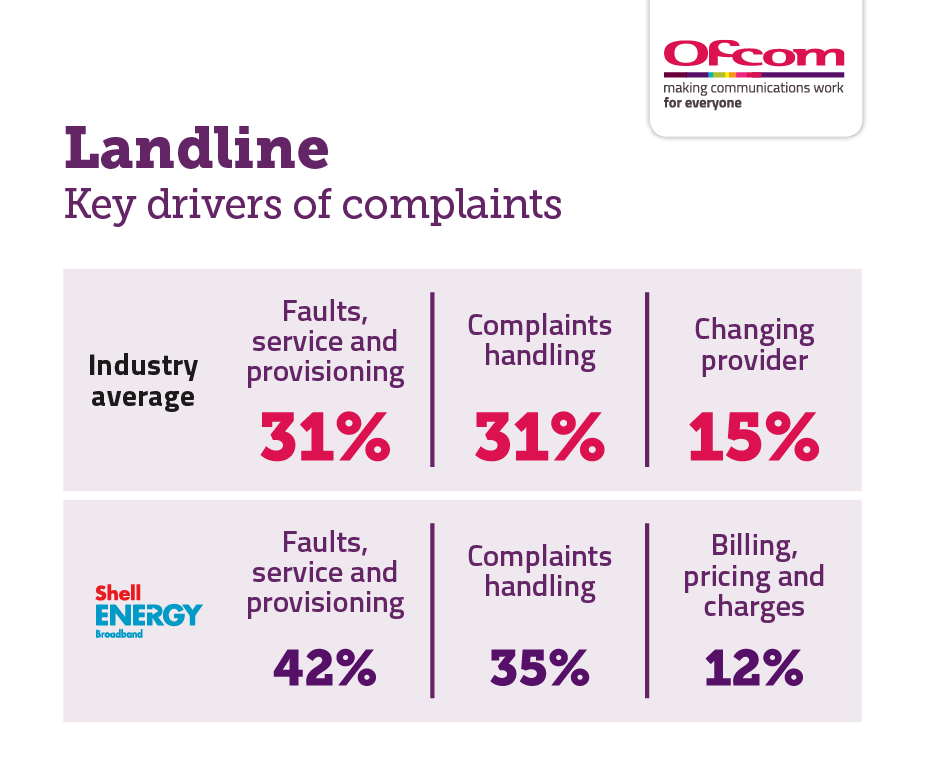
Reasons for complaining
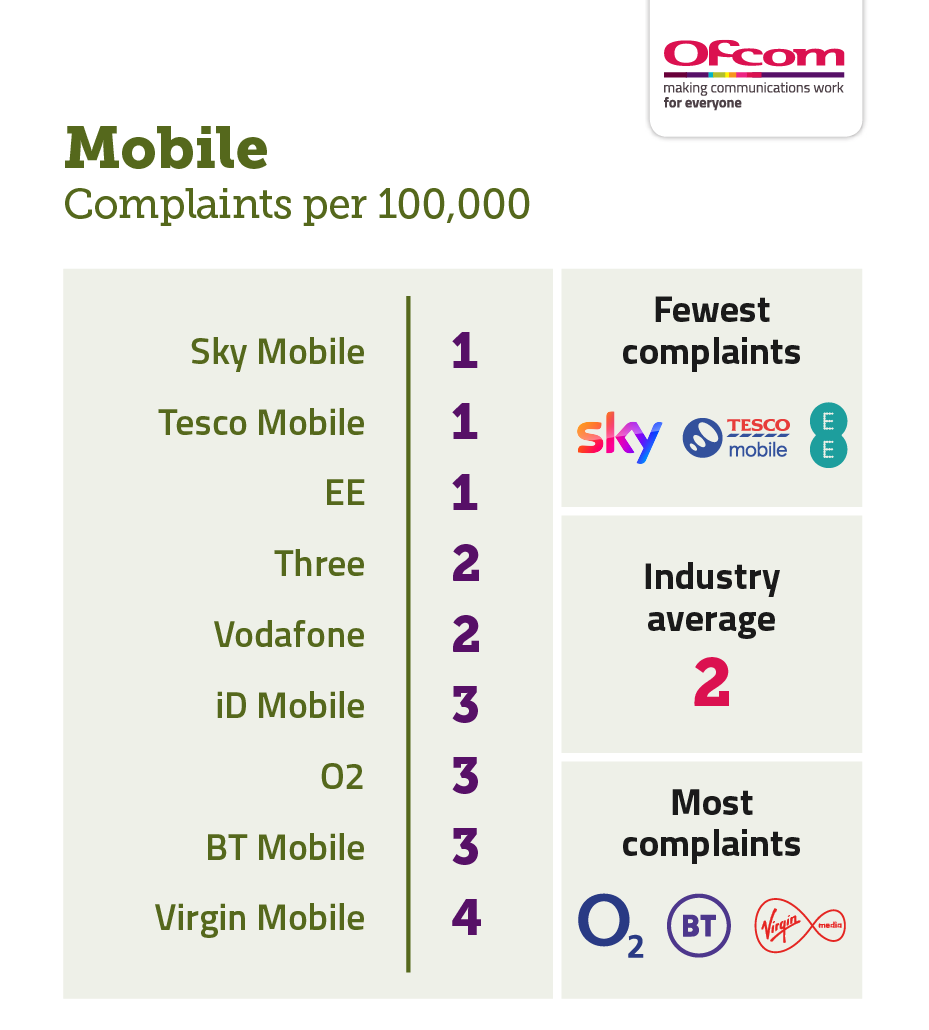
Pay-monthly mobile
How the providers ranked
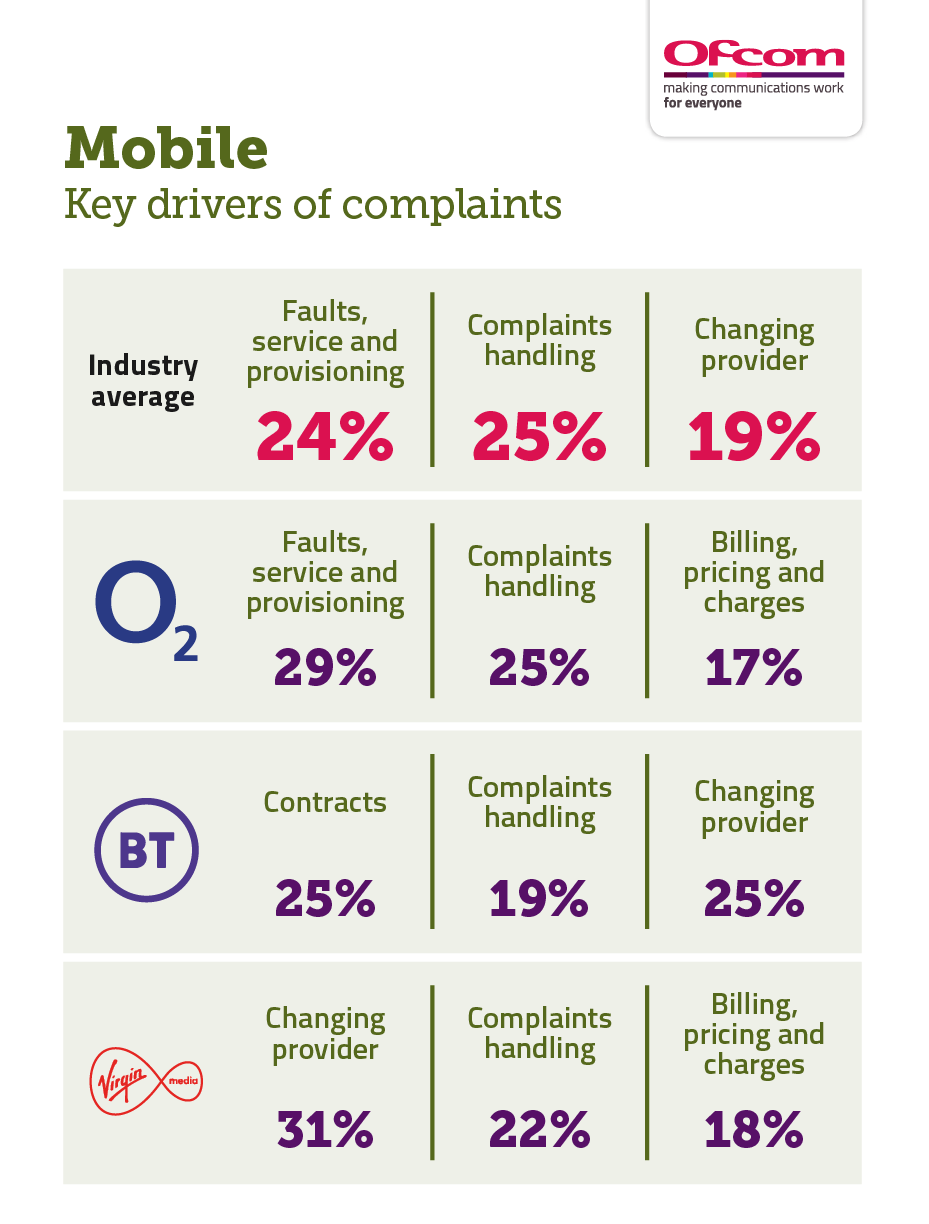
Reasons for complaining
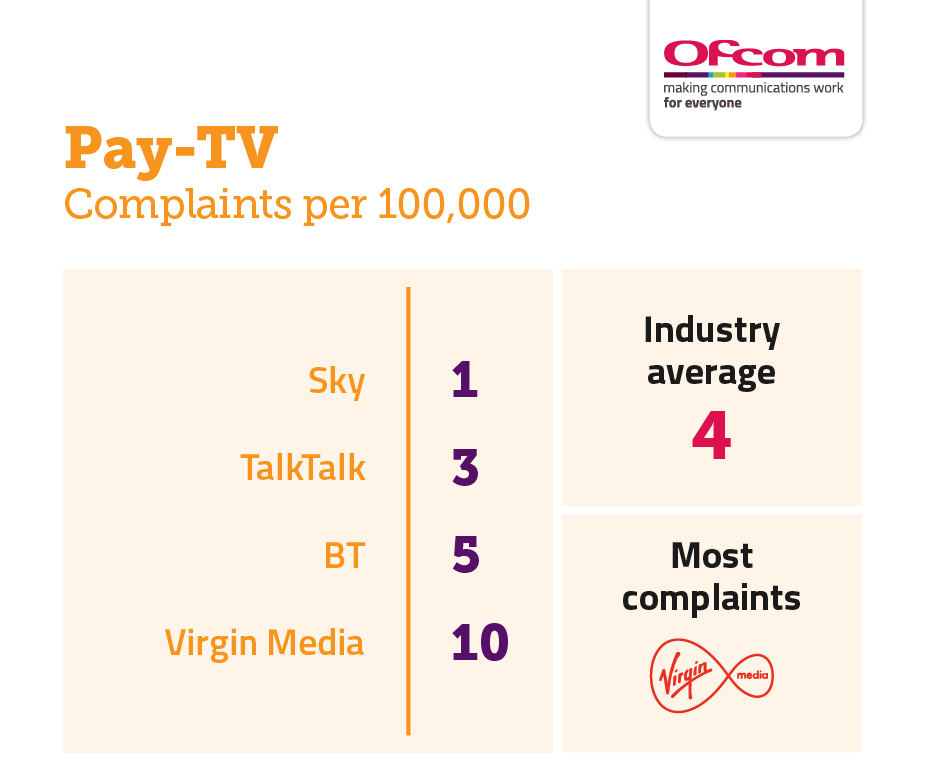
Pay-TV
How the providers ranked
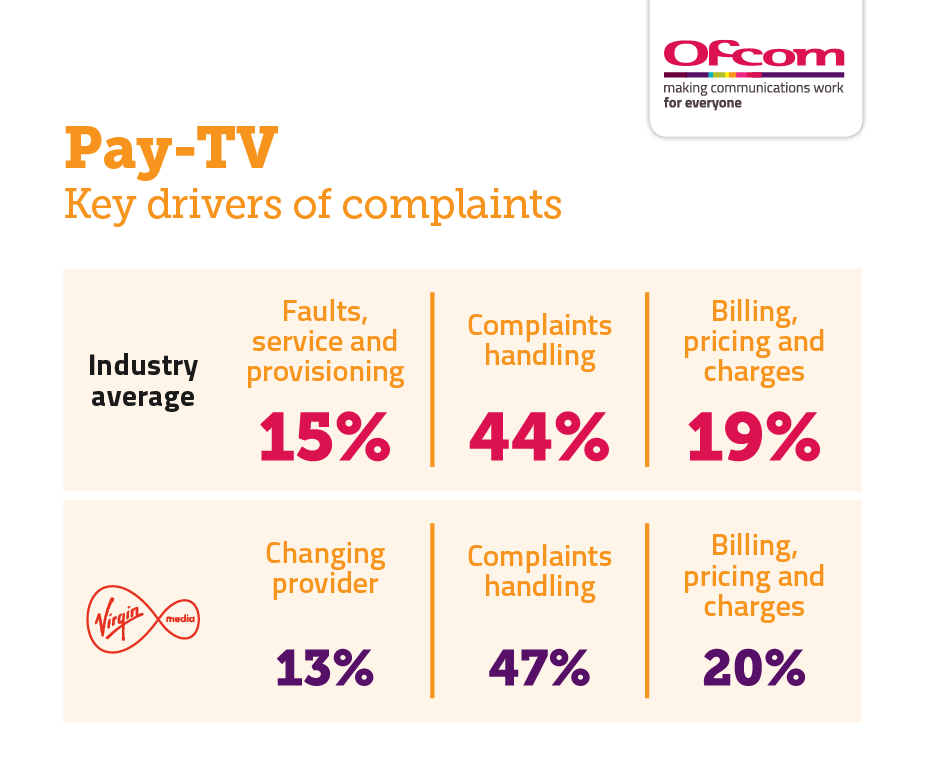
Reasons for complaining
In summary, our latest data shows that:
- Between January and March complaints to Ofcom stayed broadly at the same levels as during the previous quarter. Complaints about fixed broadband and pay TV increased slightly and complaints about landline and mobile pay-monthly stayed the same.
- Shell Energy generated the most broadband complaints per 100,000 customers, primarily due to faults, service and provisioning while EE and Sky attracted the fewest broadband complaints.
- Shell Energy was the most complained-about landline provider with complaints mainly arising because of faults, service and provisioning while EE attracted the fewest landline complaints.
- Virgin Mobile, BT Mobile and O2 were the most complained-about mobile operators. Customers were mainly unhappy with how their complaint had been handled. Sky, Tesco Mobile and EE attracted the fewest complaints.
- Virgin Media generated the highest volume of pay-TV complaints; the main reason customers complained to Ofcom was complaints handling. Sky was also the least complained-about pay-TV provider.
While the overall level of complaints has been consistently low over recent months, the gap between the best and worst providers in the broadband, landline and pay-TV sectors is widening.
The figures highlight how some firms have plenty of work to do to keep their customers happy and catch up with their rivals. If you’re not happy with the service you’re getting, consider shopping around and moving elsewhere.
Fergal Farragher, Ofcom's Consumer Protection Director
Why we publish this data
Our complaints data helps people to compare providers when they’re shopping around for a new service – and it also helps to encourage companies to improve their performance.
Although Ofcom cannot resolve individual complaints, we offer advice to people about the telecoms and pay-TV services they use, and the information we receive can lead to us launching investigations.
If you’re experiencing problems with your home phone, broadband, mobile or pay-TV service you should complain to your provider first. If you are unhappy with the outcome, you can take the complaint to an independent ombudsman, who will look at the case and make a judgment on it.
Notes for editors
Where the actual measurable difference between providers’ number of complaints per 100,000 customers is less than one, we consider their results to be comparable. Within the following sectors, we consider the listed providers to be comparable:
Fixed broadband
- EE and Sky;
- BT and NOW Broadband; and
- Vodafone and TalkTalk.
Landline
- BT, NOW Broadband and Plusnet; and
- Plusnet and industry average.
Pay-monthly mobile
- Sky Mobile, Tesco Mobile, EE and industry average;
- EE, industry average, Three and Vodafone;
- Industry average, Three, Vodafone, iD Mobile, O2 and BT Mobile; and
- O2, BT Mobile and Virgin Mobile.
