
As the UK’s communications regulator, Ofcom receives complaints from customers about their landline, fixed broadband, pay-monthly mobile and pay-TV services.
To better understand the reasons for dissatisfaction among residential customers in our sectors, we compile that data and determine the number of complaints received by provider and by service. To compare the performance of providers, on a quarterly basis we publish the number of complaints that we received about them relative to the size of their customer bases (i.e. per 100,000 customers).
Overall trends
In the quarter from January to March (Q1 2026), complaints to Ofcom decreased compared to the previous quarter (Q4 2025: October to December 2025). Complaints about fixed broadband and pay-monthly mobile decreased and complaints about landline and pay TV stayed the same.
Following the increase in complaints in Q4 2025, mainly driven by complaints about mobile services, which followed the announcement of mid-contract price rises by some mobile providers, including O2, overall complaints have continued to decline and are now back to all-time lows.
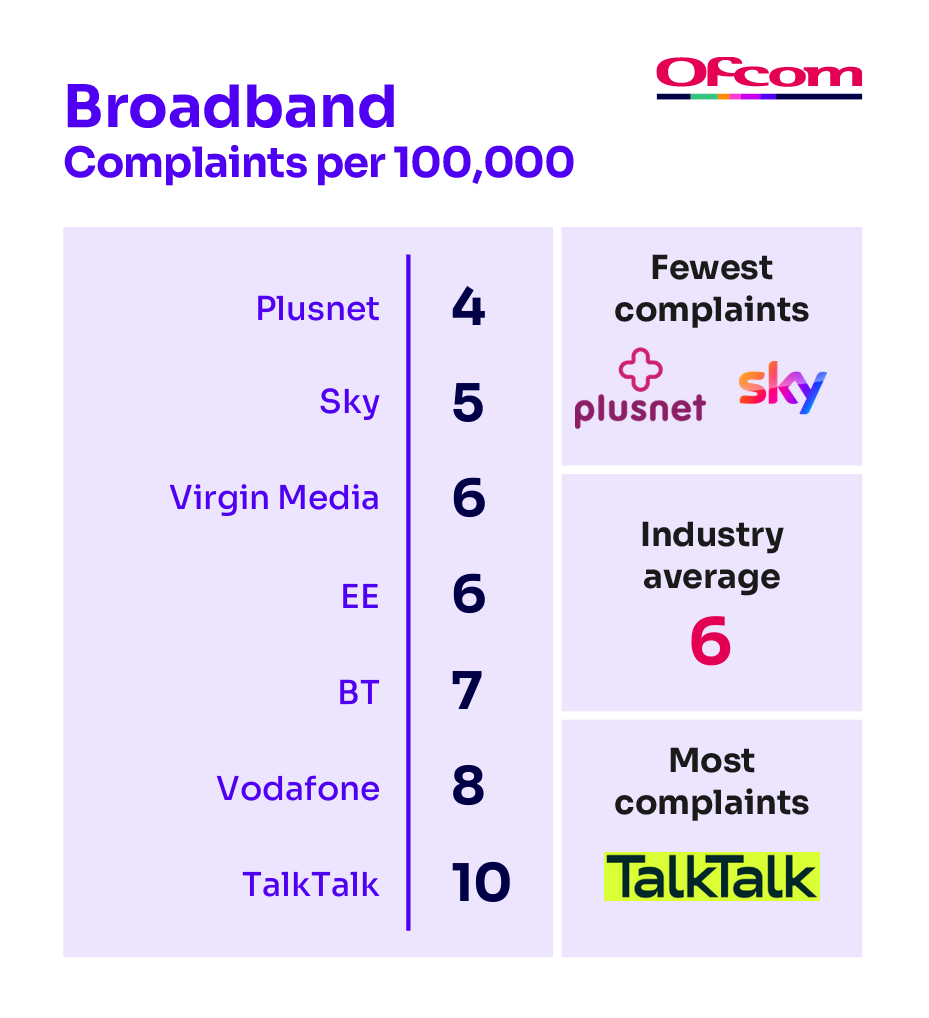
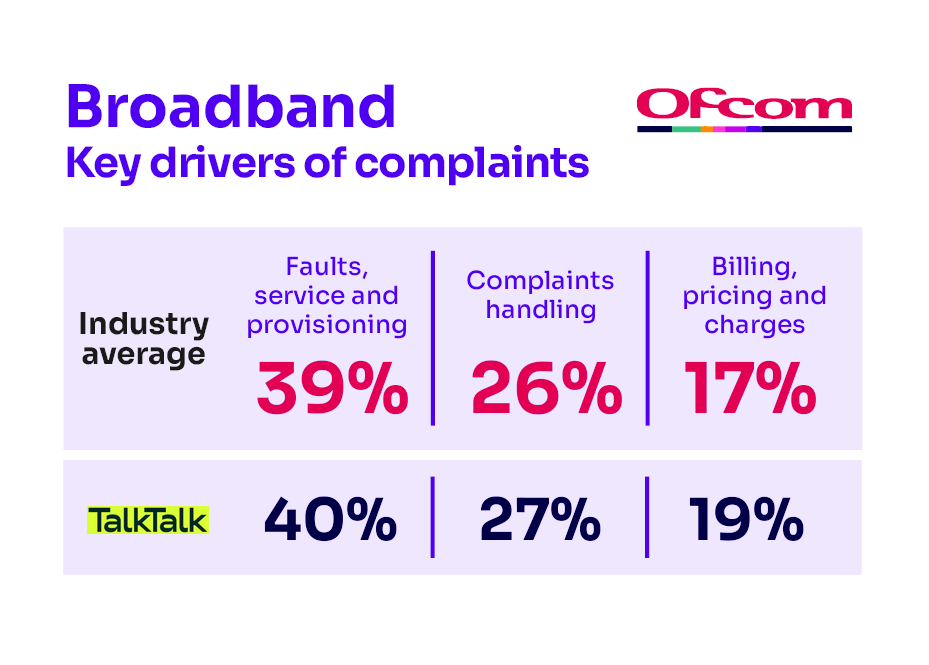
- TalkTalk was the most complained about fixed broadband provider. Complaints about TalkTalk stayed at similar levels to the previous quarter.
- Plusnet and Sky generated the least fixed broadband complaints.
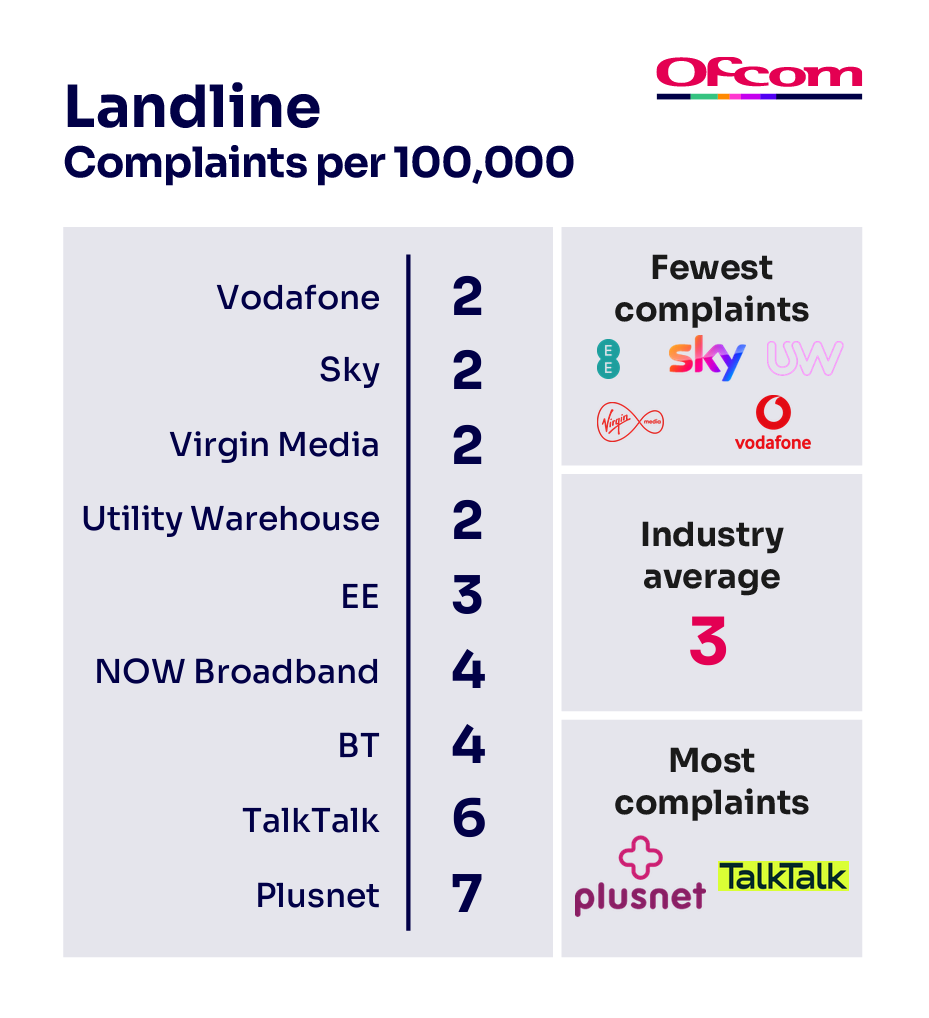
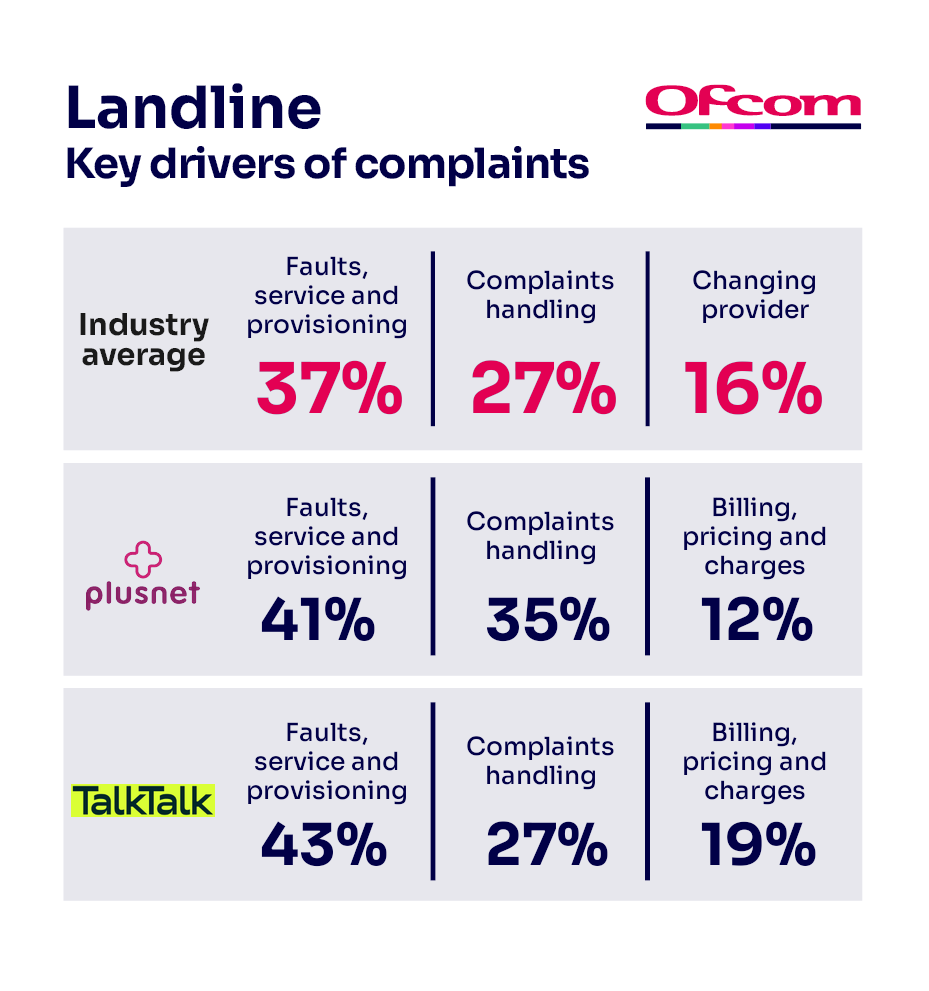
- Plusnet and TalkTalk generated the most landline complaints. Plusnet and TalkTalk saw an increase in their complaints per 100,000 subscribers compared to the previous quarter.
- EE, Sky, Utility Warehouse, Virgin Media and Vodafone were the least complained about landline providers.
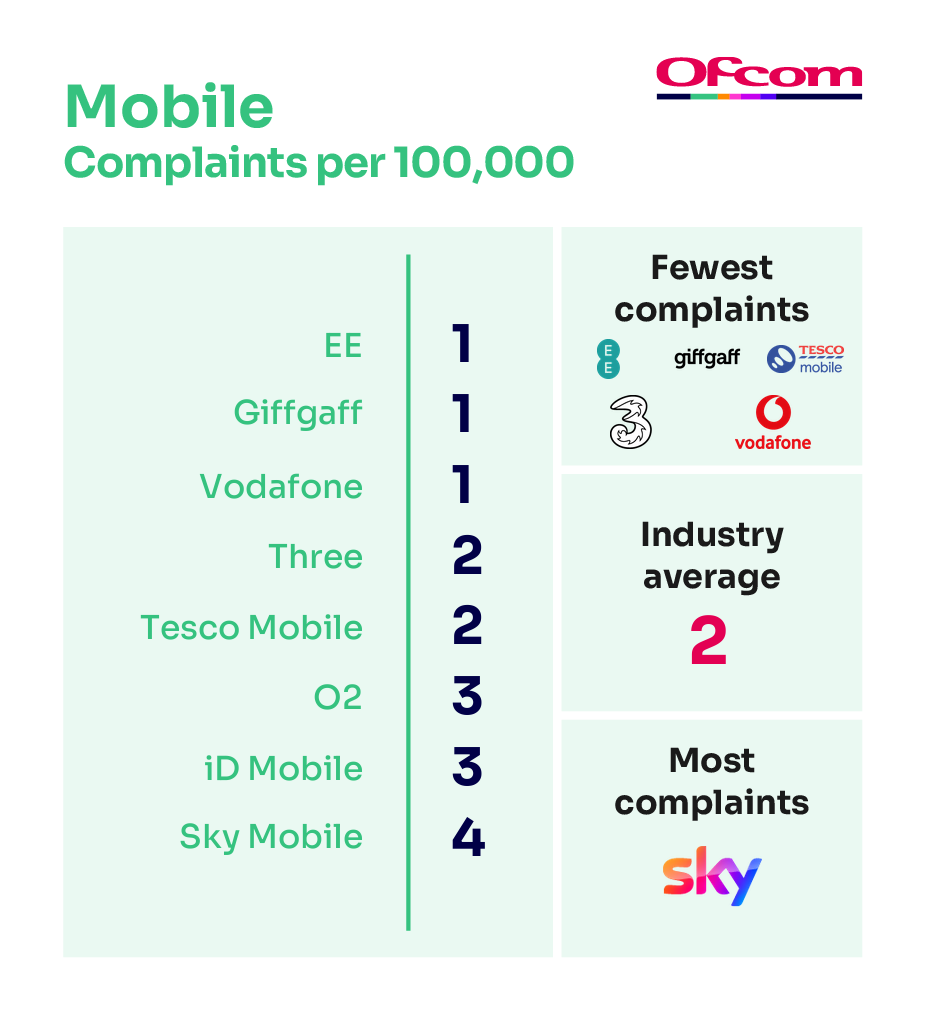
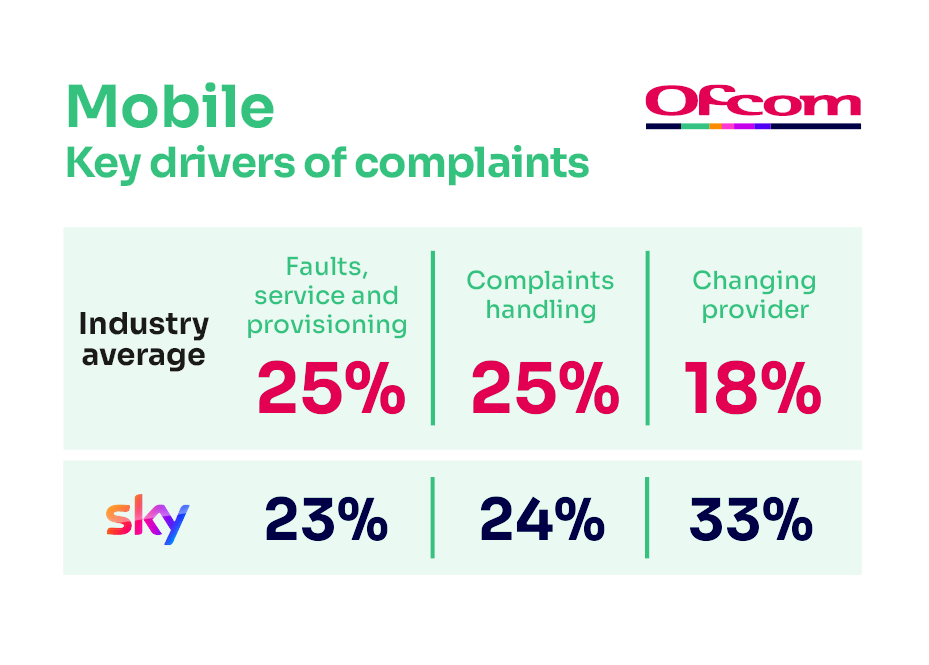
- Sky Mobile was the most complained about pay-monthly mobile provider. Customer complaints were primarily driven by experiences changing provider.
- EE, Giffgaff, Tesco Mobile, Three and Vodafone generated the least pay-monthly mobile complaints.
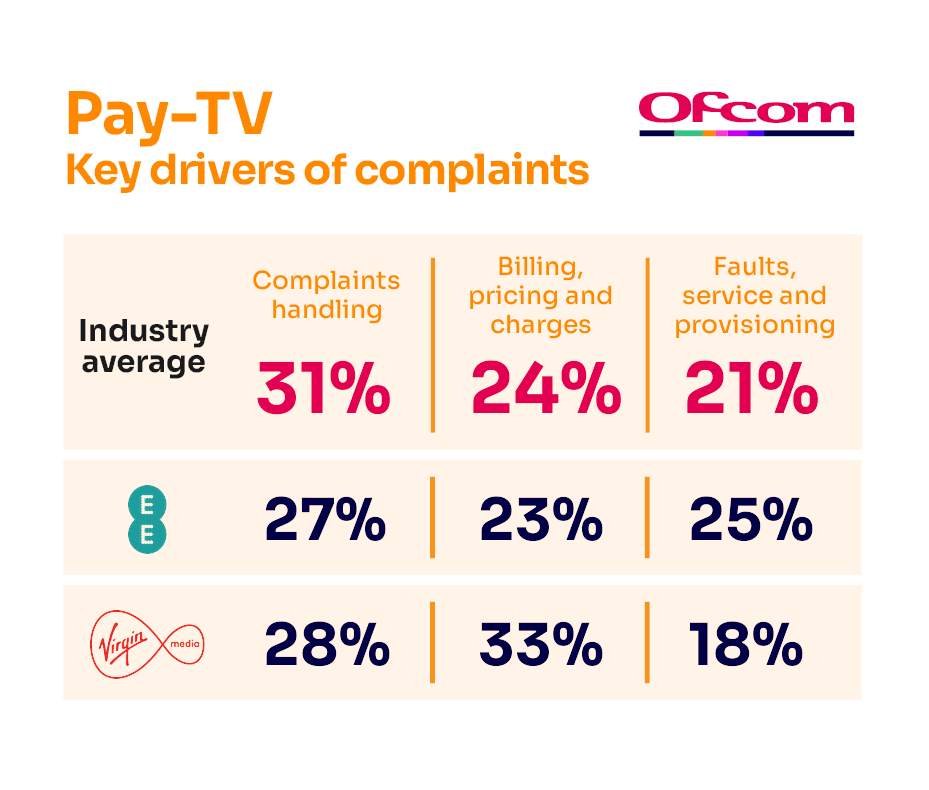
- EE and Virgin Media were the most complained about pay TV providers. Customer complaints were mainly about how their complaints were handled (EE) and problems with billing, pricing and charges (Virgin Media).
- The least complained about pay TV providers were Sky and TalkTalk.
See below for information about the comparability of certain providers’ number of complaints. Our background and methodology document goes into more detail.
The chart below shows the relative volume of complaints we have received for broadband, landline, pay-monthly mobile and pay-TV services. You can use the slider to filter by year.
Relative volume of complaints per 100,000 customers
Taking a year-on-year comparison, the relative volume of complaints about fixed broadband and landline decreased, complaints about pay-monthly mobile increased, and complaints about pay-TV stayed the same.
For the best experience, expand to full screen (click on the button in the bottom right corner).
League tables & key complaints
Fixed broadband
Landline
Pay-monthly mobile
Pay-TV

Comparability of complaints per 100,000 customers
Where the actual measurable difference between providers’ number of complaints per 100,000 customers is less than 1, we consider their results to be comparable. Within the following sectors, we consider the listed providers to be comparable:
Fixed Broadband:
- Plusnet and Sky;
- Sky, Virgin Media, EE and Industry Average;
- Industry Average and BT;
- BT and Vodafone.
Landline:
- Vodafone, Sky, Virgin Media, Utility Warehouse and EE;
- Virgin Media, Utility Warehouse, EE and Industry Average;
- NOW Broadband and BT;
- TalkTalk and Plusnet.
Pay-Monthly Mobile:
- EE, Giffgaff, Vodafone, Three, Tesco Mobile and Industry Average;
- Industry Average, O2 and iD Mobile.
Pay-TV:
- TalkTalk and Sky;
- Sky, Industry Average and Virgin Media;
- Virgin Media and EE.
Overall complaints by sector
The chart below shows complaints for all providers in each of the four sectors.
For the best experience, expand to full screen (click on the button in the bottom right corner).
Comparing different providers
To compare two or more providers’ performance, select the service and then the providers you want to compare from the lists on the right.
For the best experience, expand to full screen (click on the button in the bottom right corner).
Complaints by provider
To compare two or more providers’ performance, select the service and then the providers you want to compare from the lists on the right.
For the best experience, expand to full screen (click on the button in the bottom right corner).
More information
The underlying data is available in CSV format. We also include overall trend data for pay-as-you-go mobile complaints.
You can also read the report’s background and methodology.
Older reports
- Telecoms and pay TV complaints Q4 2025
- Telecoms and pay TV complaints Q3 2025
- Telecoms and pay TV complaints Q2 2025
- Telecoms and pay TV complaints Q1 2025
- Telecoms and pay TV complaints Q4 2024
- Telecoms and pay TV complaints Q3 2024
- Telecoms and pay TV complaints Q2 2024
- Telecoms and pay TV complaints Q1 2024
- Telecoms and pay TV complaints Q4 2023
- Telecoms and pay TV complaints Q3 2023
- Telecoms and pay TV complaints Q2 2023
- Telecoms and pay TV complaints Q1 2023
- Telecoms and pay TV complaints Q4 2022
- Telecoms and pay TV complaints Q3 2022
- Telecoms and pay TV complaints Q2 2022
- Telecoms and pay TV complaints Q1 2022
Older reports are available via the National Archives.