6 September 2021

Latest telecoms and pay-TV complaints revealed

Ofcom has today published the latest league tables on the complaints we receive about the UK’s major home phone, broadband, mobile and pay-TV firms.

The quarterly report reveals the number of complaints made to Ofcom between January and March this year about telecoms and pay-TV providers with a market share over 1.5%. It therefore covers the third UK-wide lockdown, when millions of people were required to work from home and many schoolchildren had their studies moved online.

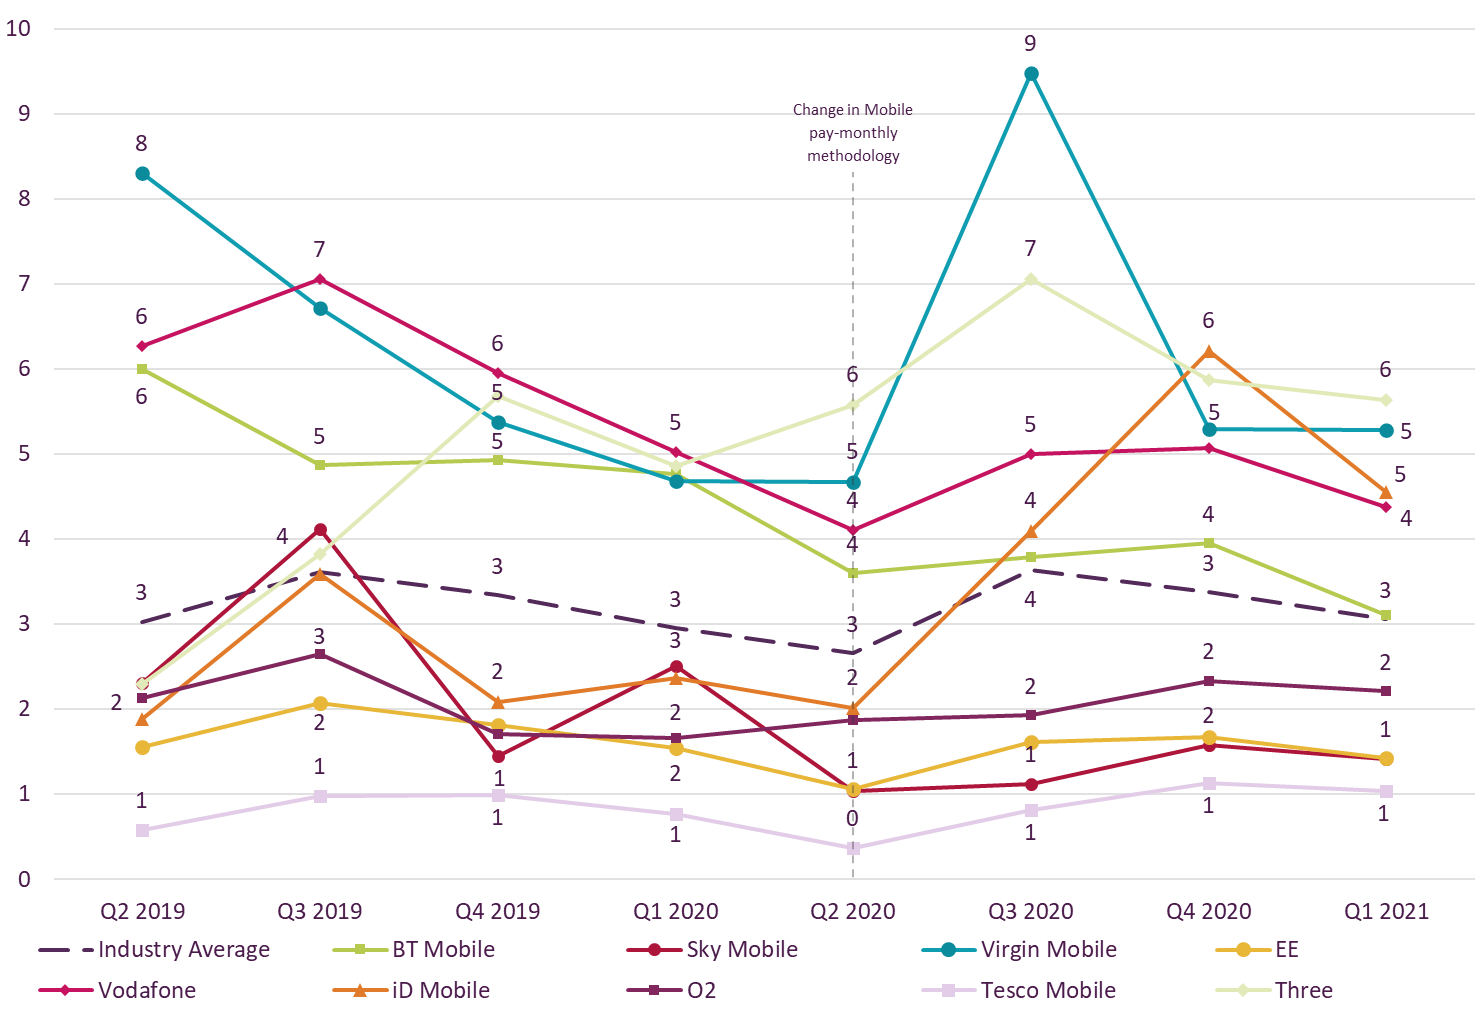
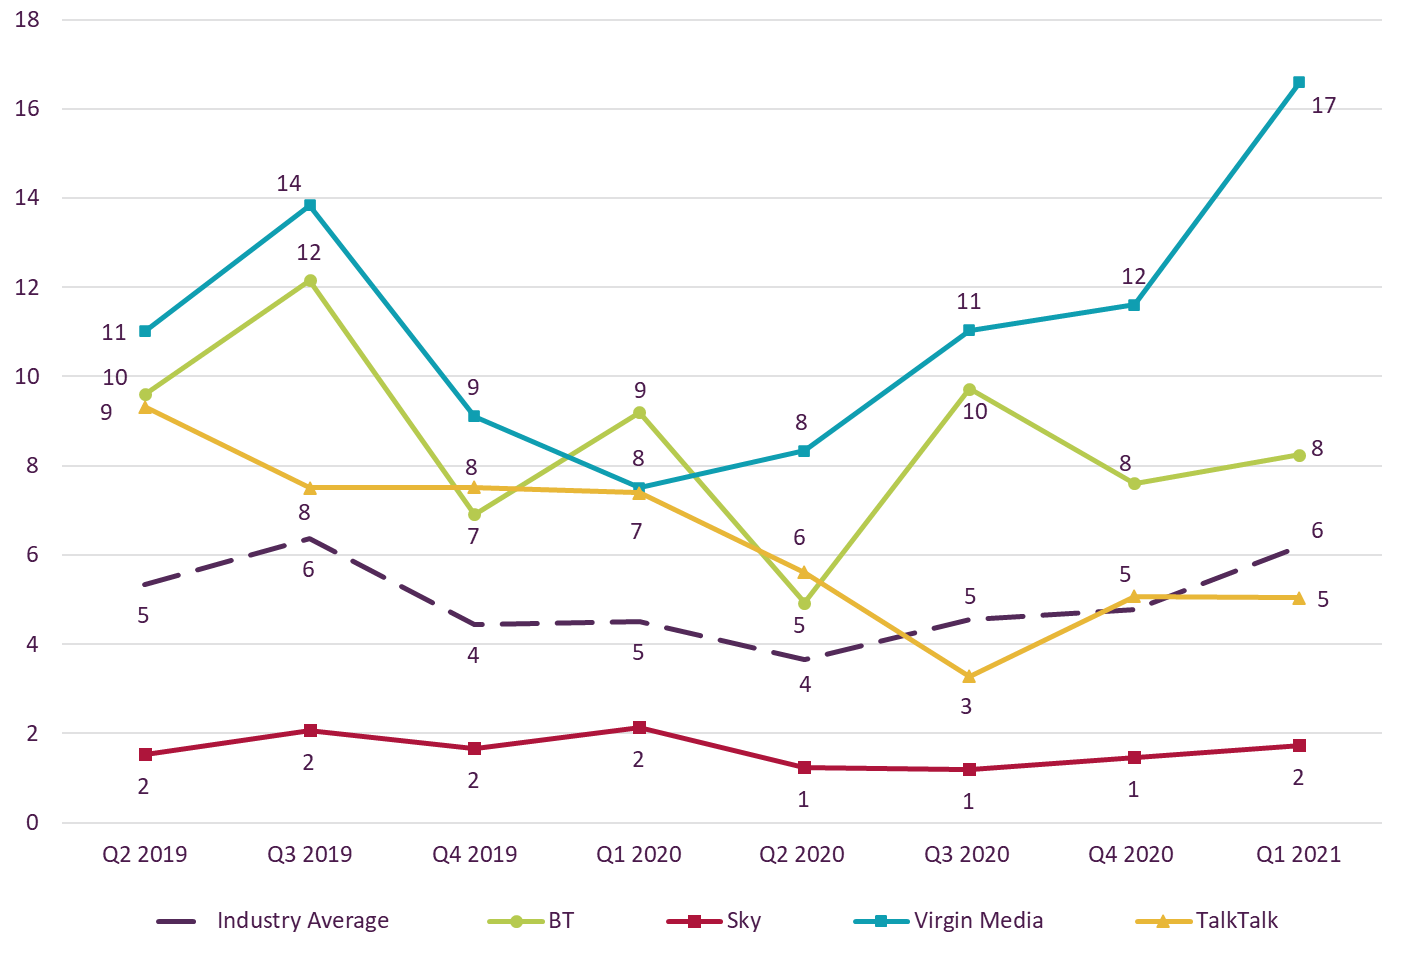
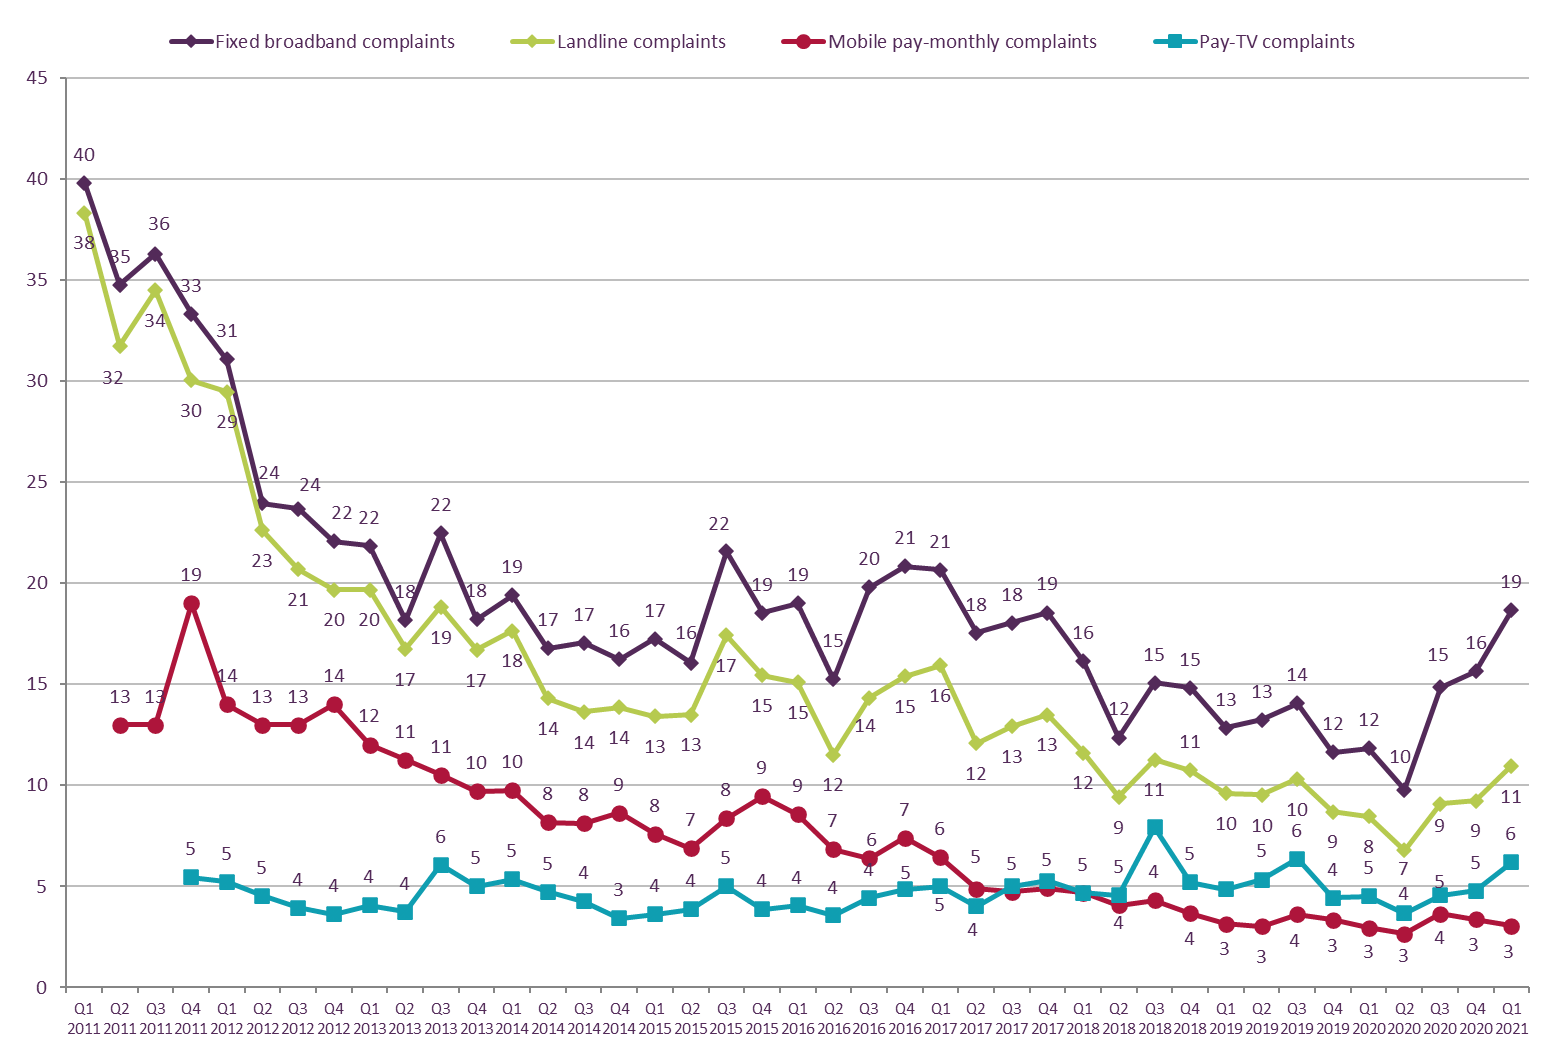
Overall, complaints about mobile services remained broadly stable. However, broadband and landline complaints hit a three-year high, while complaints about pay-TV services also increased in the quarter.

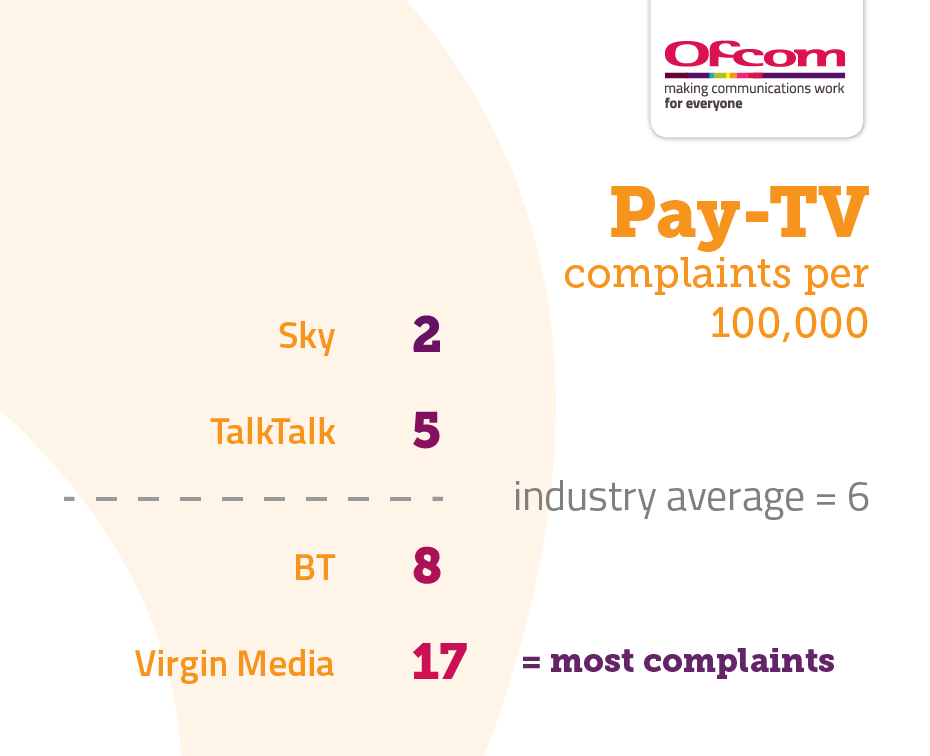
This was largely driven by Virgin Media, which was the most complained-about broadband, landline and pay-TV provider. The main reason customers complained to Ofcom about Virgin Media was to do with how the company handled their complaints.

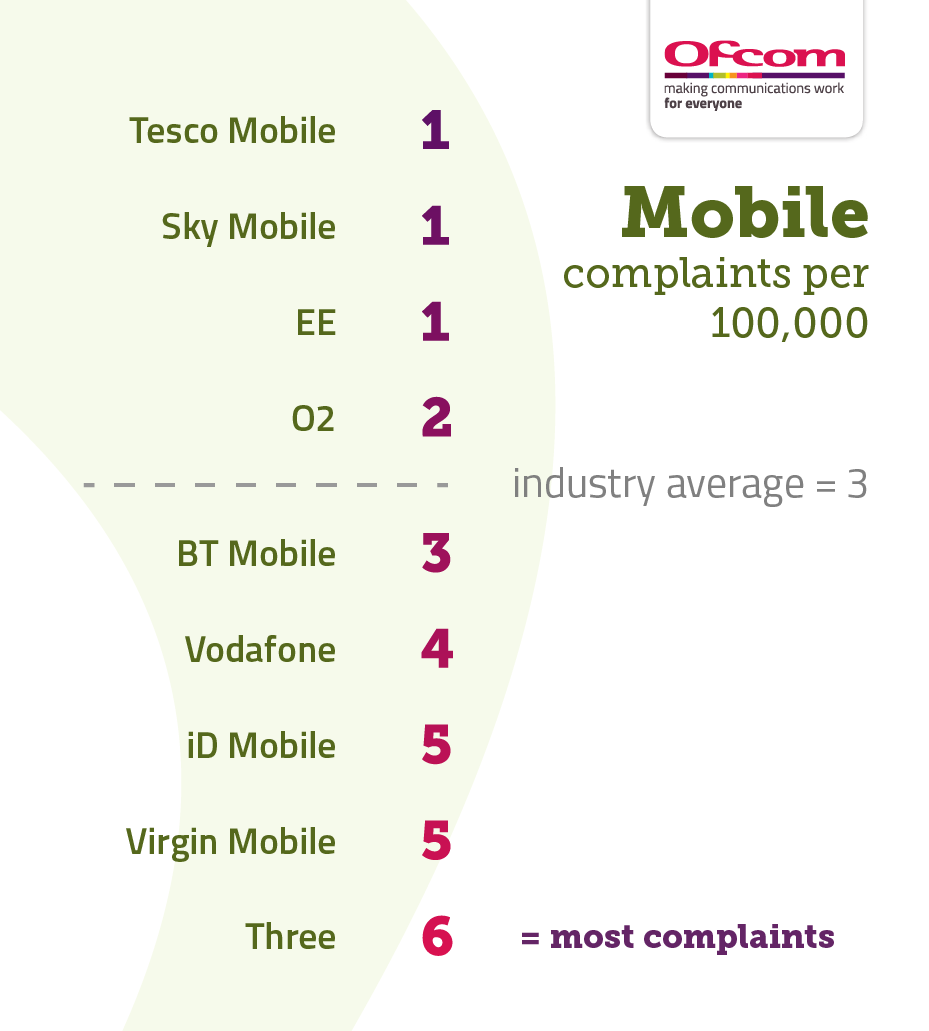
Virgin Mobile was also the most complained-about mobile operator, along with Three; while Tesco Mobile, Sky Mobile and EE generated the fewest complaints.

Sky and EE were also the least complained-about broadband and landline providers, and Sky attracted the fewest complaints for pay TV.

These complaints figures are from the peak of the pandemic, which was a difficult time for everyone, including businesses. But some providers clearly struggled with customer service more than others, and we understand how frustrating that must’ve been for their customers at a time when they needed their communications services the most.

We have been clear to providers that we expect performance to now return to at least the levels we saw before the pandemic hit – or even better.

Fergal Farragher, Consumer Protection Director

The information we publish about complaints helps people compare companies when shopping around for a new provider and encourages firms to improve their performance. Our service quality hub offers further information on how people can choose the best provider for them.

Although Ofcom cannot resolve individual complaints, we offer consumers advice, and the information we receive can lead to us launching investigations.

Anyone experiencing problems should complain to their provider first. If they are unhappy with the outcome, people can take the complaint to an independent ombudsman, who will look at the case and make a judgment on it.

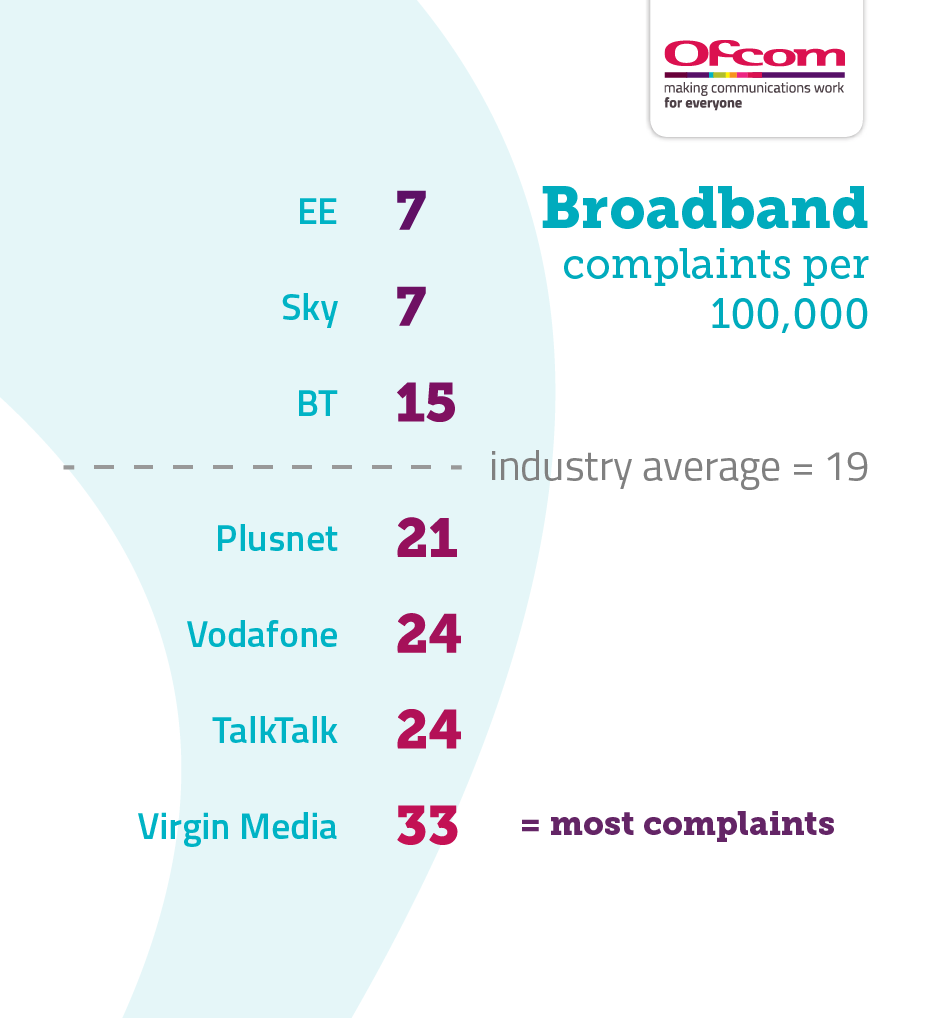
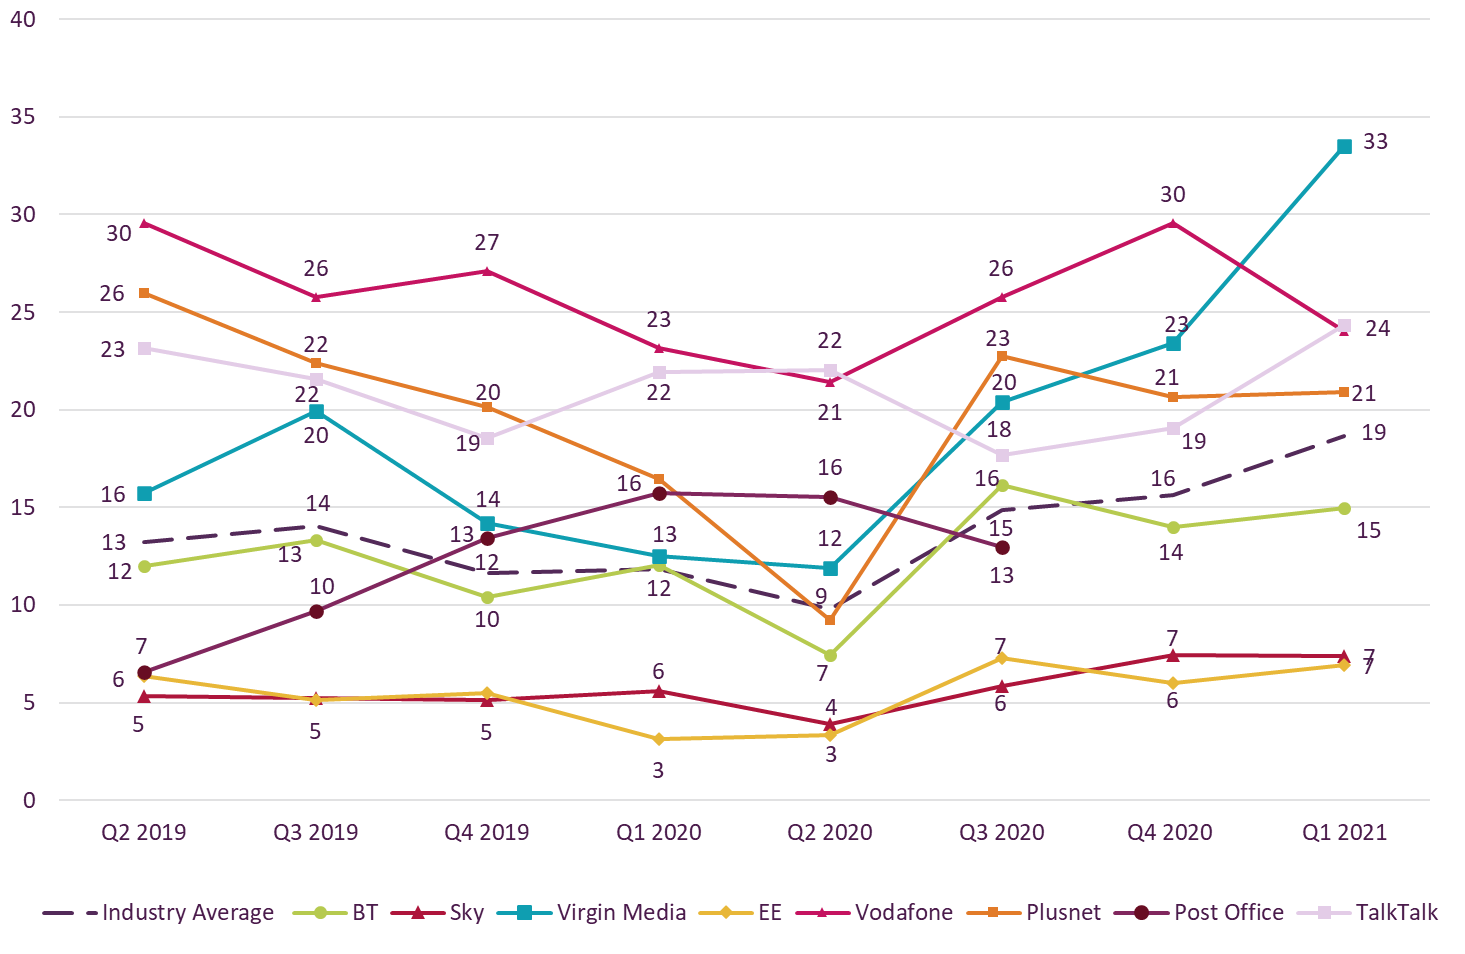
Home broadband complaints per 100,000 customers

Table showing fixed broadband complaints per 100,000 subscribers. It illustrates the providers receiving the fewest complaints at the top of the table and those receiving the most complaints are placed at the bottom of the table. The results are as follows:   EE – 7   Sky – 7   BT – 15   Industry average – 19   Plusnet – 21   Vodafone – 24   TalkTalk – 24   Virgin Media – 33
Graph showing trend data on residential consumer complaints received by Ofcom across fixed broadband by communications provider.   It shows the fixed broadband complaints per 100,000 subscribers for the Q2 2019 – Q1 2021 period.   Virgin Media generated the highest volume of fixed broadband complaints (at 33) in Q1 2021 followed by Vodafone at 24.    EE and Sky generated the lowest volume of fixed broadband complaints with both at 7.

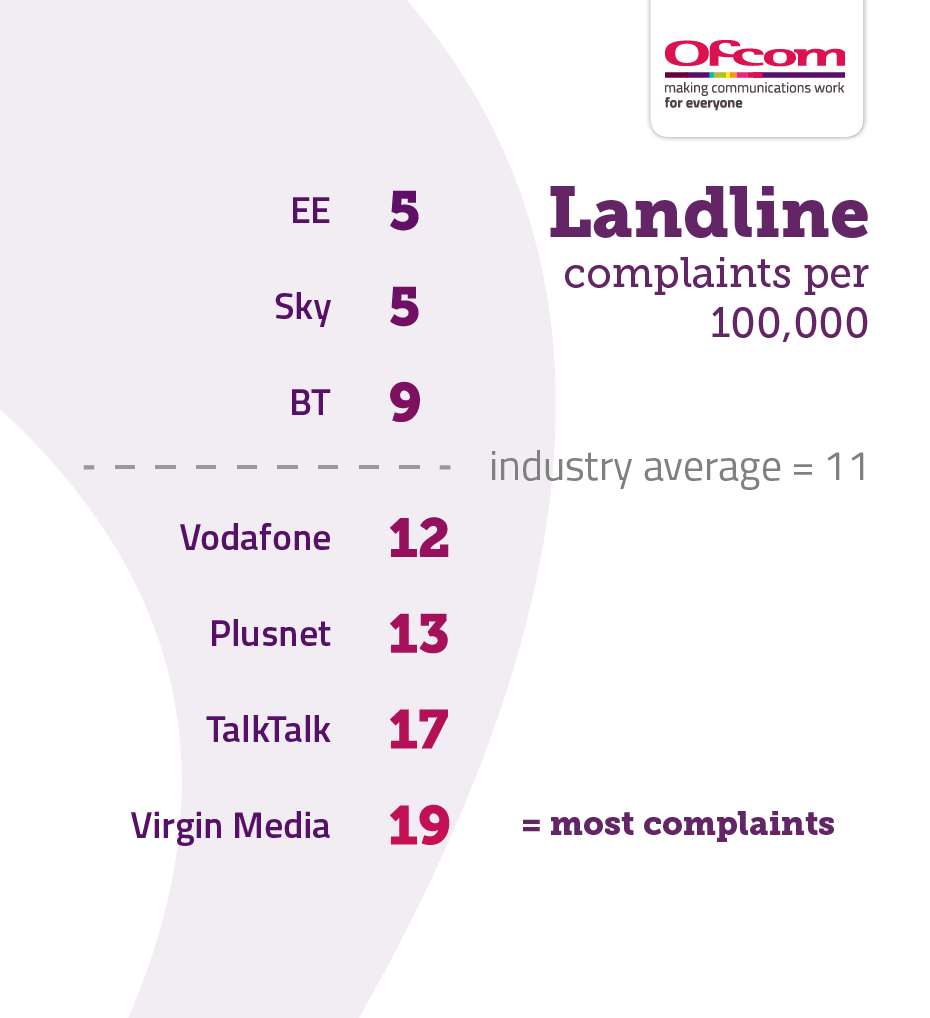
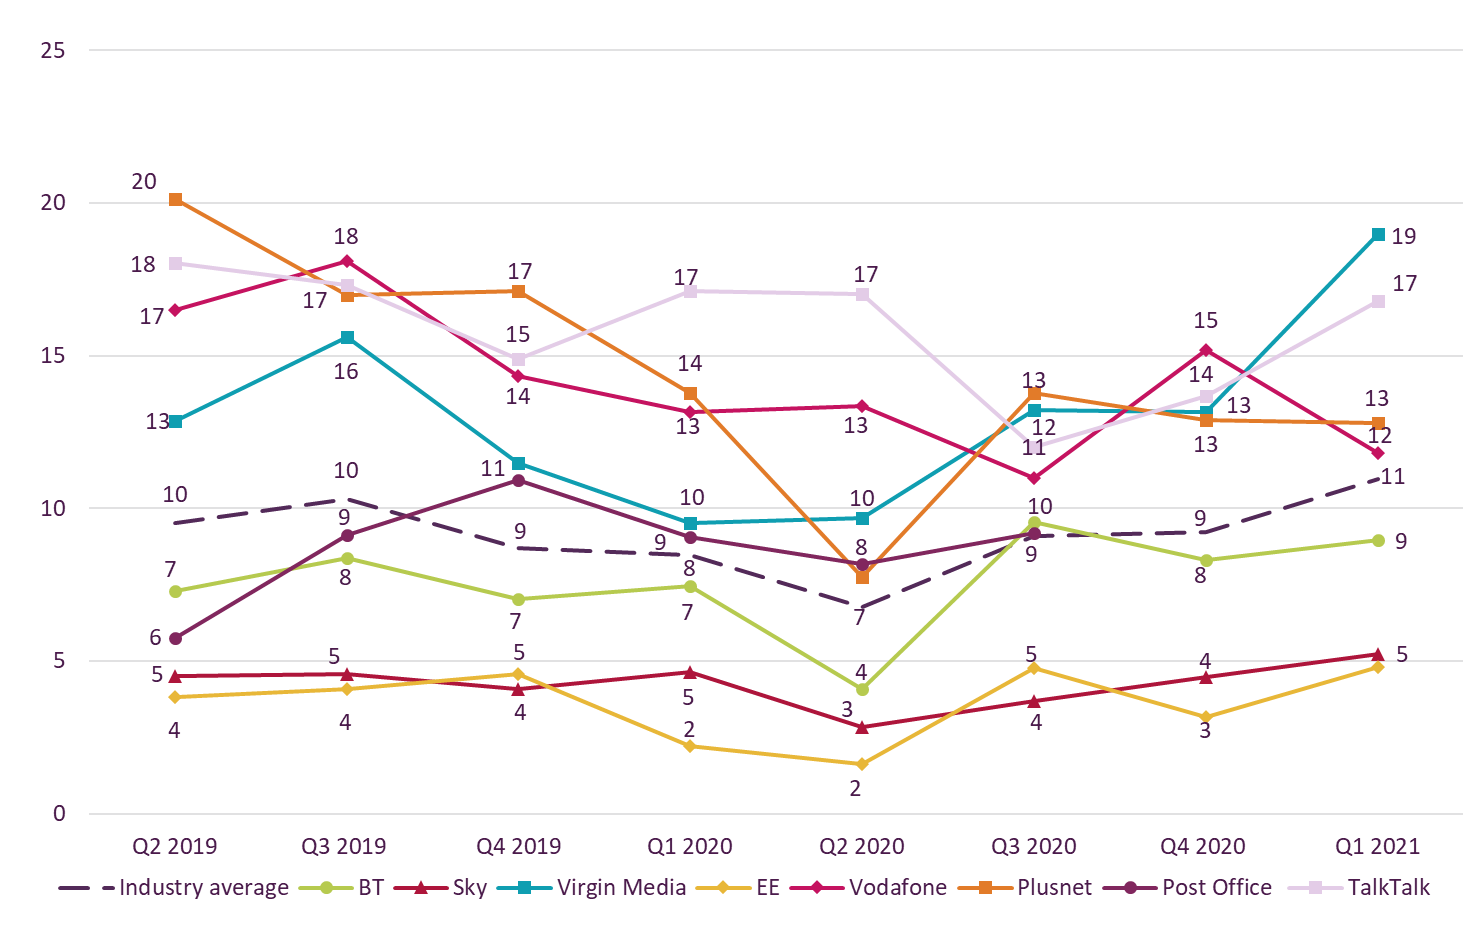
Landline telephone complaints per 100,000 customers

Table showing landline complaints per 100,000 subscribers. It illustrates the providers receiving the fewest complaints at the top of the table and those receiving the most complaints are placed at the bottom of the table. The results are as follows:   EE – 5   Sky – 5   BT – 9   Industry average – 11   Vodafone – 12   Plusnet – 13   Vodafone – 17   Virgin Media – 19
Graph showing trend data on residential consumer complaints received by Ofcom across landline by communications provider.   It shows the landline complaints per 100,000 subscribers for the Q2 2019 – Q1 2021 period.   Virgin Media generated the highest volume of landline complaints in Q1 2021 at 19.   EE and Sky continued to generate the fewest landline complaints with both at 5.

Pay-monthly mobile complaints per 100,000 customers

Table showing pay monthly mobile complaints per 100,000 subscribers. It illustrates the providers receiving the fewest complaints at the top of the table and those receiving the most complaints are placed at the bottom of the table. The results are as follows:   Tesco Mobile – 1   Sky Mobile – 1   EE – 1   O2 – 2   Industry average – 3   BT Mobile – 3   Vodafone - 4   iD Mobile – 5   Virgin Mobile – 5   Three – 6
Graph showing trend data on residential consumer complaints received by Ofcom across pay-monthly mobile by communications provider.   It shows the pay-monthly mobile complaints per 100,000 subscribers for the Q2 2019 – Q1 2021 period.    Three (6) and Virgin Mobile (5) generated the highest volume of complaints about pay-monthly mobile services in Q1 2021.   Tesco Mobile, Sky Mobile and EE generated the lowest volume of complaints at 1.

Pay-TV complaints per 100,000 customers

Table showing Pay TV complaints per 100,000 subscribers. It illustrates the providers receiving the fewest complaints at the top of the table and those receiving the most complaints are placed at the bottom of the table. The results are as follows:   Sky – 2   TalkTalk – 5   Industry average – 6   BT – 8   Virgin Media – 17
Graph showing trend data on residential consumer complaints received by Ofcom across pay TV by communications provider.   It shows the pay TV complaints per 100,000 subscribers for the Q2 2019 – Q1 2021 period.   Virgin Media was the most complained-about pay TV provider in Q4 2020 at 17.   Sky continued to generate the lowest volume of pay TV complaints at 2.

Relative volume of complaints per service per 100,000 subscribers

Graph showing trend data on residential consumer complaints received by Ofcom across landline, fixed broadband, pay-monthly mobile and pay TV services, by communications provider It shows the relative volume of complaints per sector per 100,000 subscribers for the Q1 2011 – Q1 2021 period. The relative volume of complaints per 100,000 subscribers for broadband increased by comparison with Q4 2021 from 16 to 19. The relative volume of complaints for landline increased from 9 to 11. The relative volume of complaints for pay TV increased from 5 to 6. The relative volume of complaints for mobile remained broadly the same at 3.

NOTES TO EDITORS

  1. The actual measurable difference between the following fixed broadband providers’ number of complaints per 100,000 customers was less than 1 and so their results should be considered comparable: 1. EE and Sky; and 2. Vodafone and TalkTalk.
  2. The actual measurable difference between the following landline providers’ number of complaints per 100,000 customers was less than one and so their results should be considered comparable: 1. EE and Sky; 2. industry average and Vodafone; and 3. Vodafone and Plusnet.
  3. The actual measurable difference between the following pay-monthly mobile providers’ number of complaints per 100,000 customers was less than one and so their results should be considered comparable: 1. Tesco Mobile, Sky Mobile and EE; 2. Sky Mobile, EE and O2; 3. O2, industry average, and BT Mobile; 4. Vodafone, iD Mobile, and Virgin Mobile; and 5. Virgin Mobile and Three.

Contact the media team

If you are a journalist wishing to contact Ofcom's media team:

Call: +44 (0) 300 123 1795 (journalists only)

Send us your enquiry (journalists only)

If you are a member of the public wanting advice or to complain to Ofcom:

Rate this page

Was this page helpful?

Contact the media team

If you are a journalist wishing to contact Ofcom's media team:

Call: +44 (0) 300 123 1795 (journalists only)

Send us your enquiry (journalists only)

If you are a member of the public wanting advice or to complain to Ofcom:

Related content