

Ofcom has today published the latest league tables on the complaints we receive about the UK’s major home phone, broadband, mobile and pay-TV firms.
The quarterly report reveals the number of complaints made to Ofcom between April and June this year, when the UK’s lockdown restrictions began to ease.
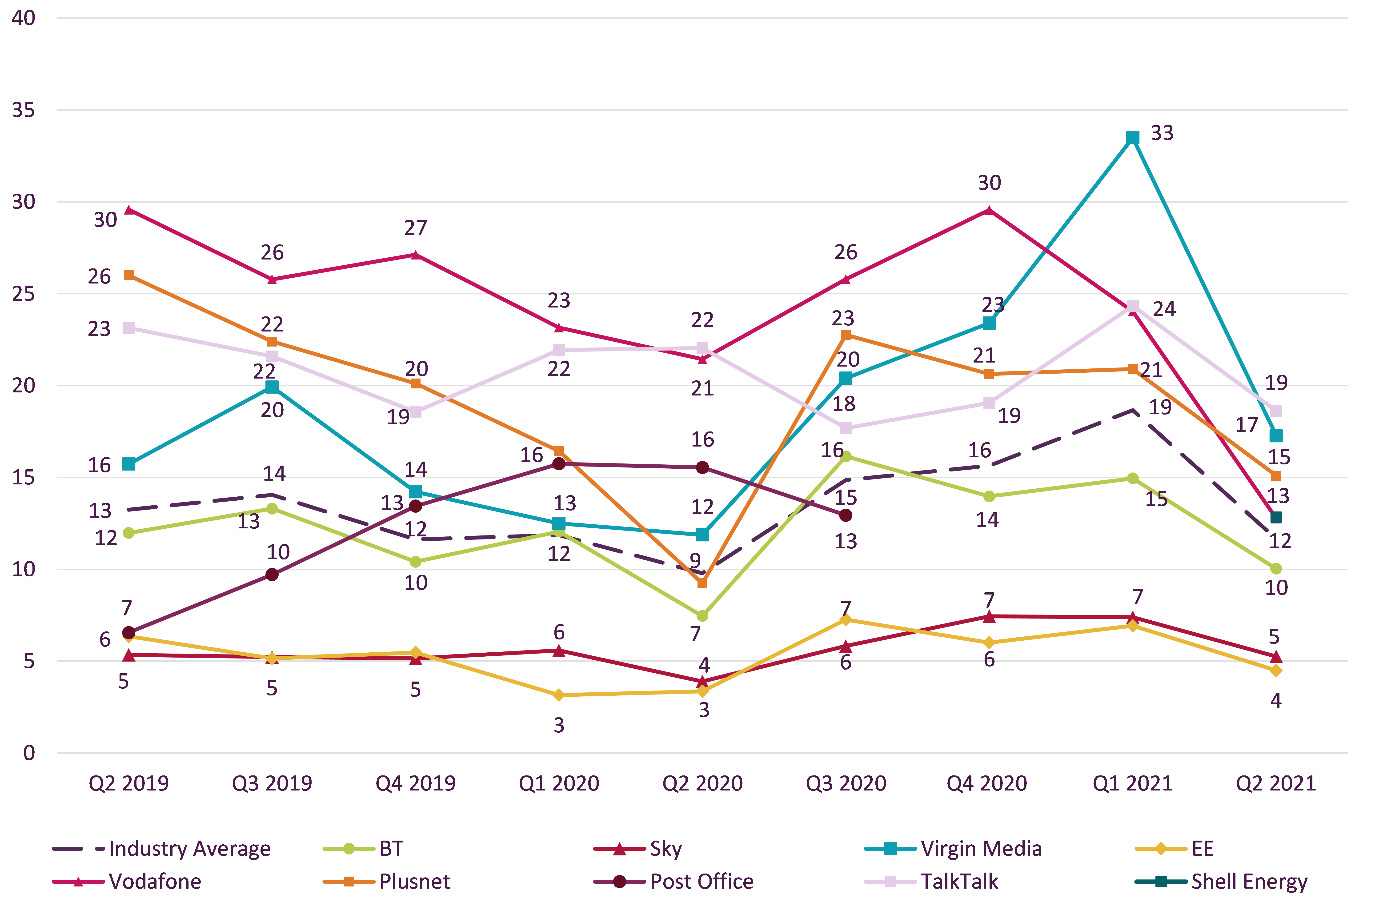
Complaints in this quarter fell across the board to levels seen before the Covid-19 pandemic.
Virgin Media in particular saw its complaint volumes reduce significantly across all four sectors, after Ofcom raised concerns with the provider about its customer service in the previous quarter.
However, it was still the most complained-about pay-TV provider. The main reason customers complained to Ofcom about Virgin Media was to do with how the company handled their complaints.
TalkTalk generated the most complaints for broadband and landline, primarily due to faults and service issues.
Virgin Mobile was the most complained-about mobile operator, along with Three and Vodafone; while Tesco Mobile, BT Mobile, Sky Mobile, EE and O2 were all tied as least complained-about operators.
EE and Sky were also the least complained-about broadband and landline providers, and Sky attracted the fewest complaints for pay TV.
Following Shell Energy’s purchase of Post Office’s telecoms business, it is included in our complaints report for the first time.
It’s encouraging to see complaints figures falling across the board to pre-pandemic levels, but providers cannot be complacent about their customer service.
Those with a consistently high number of complaints still have a lot of work to do to ensure they meet the expectations of their customers.
Fergal Farragher, Ofcom’s Consumer Protection Director
The information we publish about complaints helps people compare companies when shopping around for a new provider and encourages firms to improve their performance. Our service quality hub offers further information on how people can choose the best provider for them.
Although Ofcom cannot resolve individual complaints, we offer consumers advice, and the information we receive can lead to us launching investigations.
Anyone experiencing problems should complain to their provider first. If they are unhappy with the outcome, people can take the complaint to an independent ombudsman, who will look at the case and make a judgment on it.
Home broadband complaints per 100,000 customers

Landline telephone complaints per 100,000 customers


Pay-monthly mobile complaints per 100,000 customers


Pay-TV complaints per 100,000 customers


Relative volume of complaints per service per 100,000 subscribers

NOTES TO EDITORS
- The actual measurable difference between the following fixed broadband providers’ number of complaints per 100,000 customers was less than 1 and so their results should be considered comparable: 1. EE and Sky; and 2. Vodafone and Shell Energy.
- The actual measurable difference between the following landline providers’ number of complaints per 100,000 customers was less than one and so their results should be considered comparable: 1. EE and Sky; 2. BT and Vodafone; 3. Vodafone and industry average; and 4. Virgin Media and Shell Energy.
- The actual measurable difference between the following pay-monthly mobile providers’ number of complaints per 100,000 customers was less than one and so their results should be considered comparable: 1. Tesco Mobile, BT Mobile, Sky Mobile, EE and O2; 2. Sky Mobile, EE, O2 and industry average; 3. EE, O2, industry average and iD Mobile; 4. Industry average, iD Mobile, Vodafone and Three; and 5. Vodafone, Three and Virgin Mobile.
- The actual measurable difference between TalkTalk and BT’s number of complaints per 100,000 customers for pay TV was less than one and so their results should be considered comparable.
Contact the media team
If you are a journalist wishing to contact Ofcom's media team:
Call: +44 (0) 300 123 1795 (journalists only)
Send us your enquiry (journalists only)
If you are a member of the public wanting advice or to complain to Ofcom: